By Friedrich Huebler and Elise Legault, Programme Specialists at the UNESCO Institute for Statistics
This blog was also published by the Global Partnership for Education (GPE).

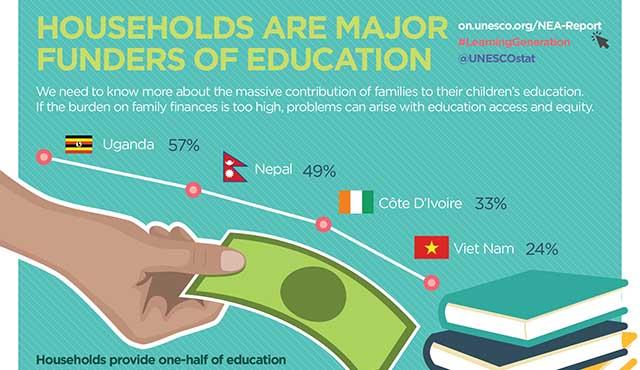
We know too little about education finance: where the money for education comes from, where it goes, and whether it is spent effectively. Drawing on today’s major release of new data, the UNESCO Institute for Statistics (UIS) shows that even the most robust government data on education spending misses out a crucial part of the financing equation: the money spent by households on the education of their children.
The UIS data release covers all levels of education for countries around the world, including global and thematic indicators used to monitor SDG 4, which are presented in a series of interactive maps of the newly updated eAtlas for Education 2030. In addition, the release includes new UIS indicators on household spending on education, which confirm that the world is still far from the goal of providing free basic education.
Spanning household spending per student at the primary, secondary and tertiary levels, the data cover not only the major costs of education, including tuition fees, textbooks and other materials, but also the costs of uniforms and other hidden expenses. The concern is that, as a result of such costs, the poorest children and youth are denied their right to a basic education.
Out-of-pocket expenses for families are high for primary education and rise even more at secondary level
Across the countries with available data, out-of-pocket expenses for parents remain high even at the primary level. This is alarming, given the Sustainable Development Goal 4 (SDG 4) to provide free primary and secondary education to all. In Ghana, households spend annually about $87 per child in primary education, while this figure increases to $151 in Côte d’Ivoire and to $680 in El Salvador.[1]
If financial pressures on families mean that children do not start school or drop out before completing their education, their prospects are permanently undermined, as are the chances of achieving SDG 4. Household expenses often increase sharply when students reach secondary education. Household spending per student reaches $228 a year in Ghana and $637 in Côte d’Ivoire—in the latter, this is more than four times the cost of primary education. In Benin, households are actually spending more per secondary student ($402) than the government ($259).
Households in developing countries spend more on their children’s education than in developed countries
UIS data also confirm that households in many developing countries are spending a far greater proportion of their average GDP per capita on education than those in developed countries. While this demonstrates their deep commitment to the education of their children, it also raises concerns about the prospects of achieving the global education goal, when such a heavy burden of current spending lies on the shoulders of families. For example, household expenses on secondary education amount to 20-25% of average GDP per person in Benin, Chad, Côte d’Ivoire, Guinea, and Niger, and more than 30% in Togo. By contrast, in almost all rich countries this share does not exceed 5%.
To produce the new indicators, the UIS complemented data on household spending as submitted by countries through the UIS annual education survey with data from household surveys processed by IIEP-Pôle de Dakar in the context of Education Country Status Reports (CSR/RESEN) for 14 sub-Saharan African countries. A few additional surveys available from the World Bank Microdata Catalogue were also processed directly by the UIS, with more to come in the next data releases. In total, the new indicator “Initial household funding per student” is now available for at least one year and one level of education for more than 80 countries.
The UIS is also releasing a new paper, which sheds light on how education expenditure data are collected in household surveys and explains why comparisons between countries can be difficult. The findings will be applied by the UIS, the World Bank and other partners to develop more comprehensive guidelines for data analysis and for the design of education expenditure modules in household surveys.
The release of new data on household spending is a welcome addition to the data already produced by the UIS on government spending and a major step forward for the production of indicators to monitor progress on SDG 4. The next step is to analyse and disseminate data on international sources of funding to build a complete picture of who is spending what on education.
*****
Explore the new data! As part of the UIS commitment to open data, the Institute has increased the amount of data available through its API (application program interface). Users can download more than 3,785 indicators and data from 1970 and onwards. The UIS Data Centre also includes regional averages and new indicators on a range of issues, such as pre-primary and early childhood education, gender parity and education spending.
[1] Expenditure amounts are reported in international dollars (purchasing power parity, PPP), which are calculated by adjusting exchange rates in accordance with national price levels. An international dollar buys a comparable amount of goods and services in a given country as a U.S. dollar buys in the United States (https://datahelpdesk.worldbank.org/knowledgebase/articles/114944-what-is-an-international-dollar).

0 Comments