La información completa aquí:
http://www.timeshighereducation.co.uk/world-university-rankings/
For the third year in a row, CalTech keeps its place at the top of Times Higher Education’s 2013 rankings of the top 100 universities worldwide.
Harvard University moves up two places to join Oxford at joint second place; Stanford drops to No. 4.
Forty-six of the top 100 spots are occupied by American universities, seven of those in the top 10.
Dive Insight:
After the United States, the U.K. has the second most universities on the list. The full rankings can be explored here. Or view a Google spreadsheet with this year’s rankings compared to last year’s.
——————-
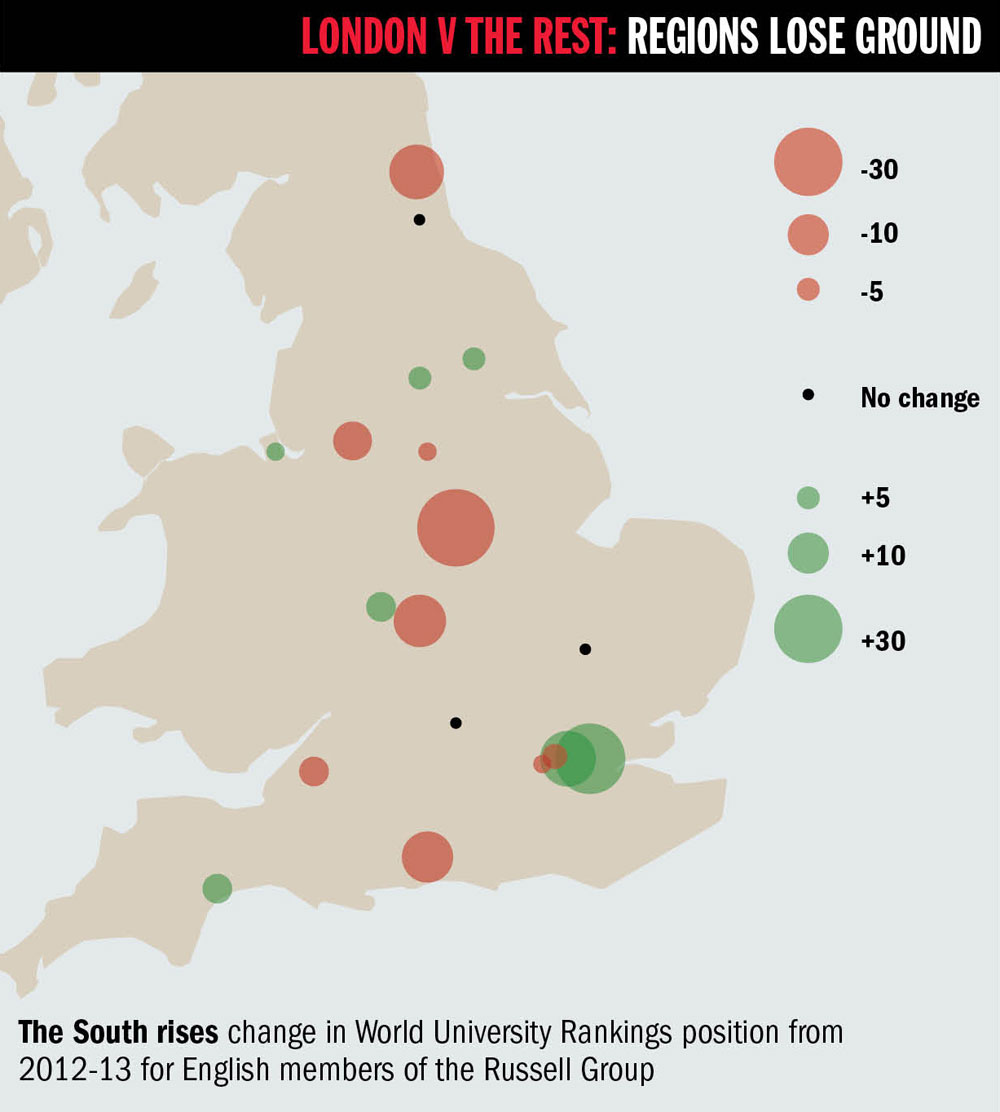
World University Rankings 2013-2014: London outruns UK regions
Times Higher Education, 3 OCTOBER 2013 | BY ELIZABETH GIBNEY
Good news for capital, but fears grow that data reflect growing UK inequality

SOURCE: GETTY
The megalopolis multiplier effect: there are fears that London’s powerful pull for leading researchers may be difficult to counteract
View the THE World University Rankings 2013-2014 top 400
While universities in London go from strength to strength, power may be draining from the UK regions, analysis of the Times Higher EducationWorld University Rankings 2013-2014 suggests.
The UK has maintained its global position, with 14 institutions climbing, 14 falling and three static in the top 200, but the picture masks considerable changes on geographical lines.
Universities within London, Oxford and Cambridge – the “golden triangle” – have risen by six places on average, compared with a fall of two places among institutions in the rest of the country.
As the universities of Oxford and Cambridge maintain their 2012-13 positions (joint second and seventh, respectively), the London School of Economics climbs seven places to 32nd and King’s College London jumps from 57th to 38th. Two other institutions in the capital gain ground: Royal Holloway, University of London climbs from 119th to 102nd, and Queen Mary, University of London rises from joint 145th to joint 114th. Bucking the trend are Imperial College London (down two places to 10th) andUniversity College London (which drops four places to 21st).
Meanwhile, losing ground are the universities of Edinburgh (39th, down from 32nd), Manchester (58th from 49th), Bristol (79th from 74th),Sheffield (joint 112th from joint 110th) and St Andrews (joint 117th from 108th).
Further down the table, the universities of Sussex, Warwick,Southampton, Aberdeen, Reading and Newcastle all fall by 10 places or more. The University of Nottingham has dropped the most, falling 37 places to joint 157th.
The results mean that London alone boasts six top 200 players, more than Japan, the world’s third-largest economy.
Jeremy Kilburn, vice-principal of Queen Mary, attributed his institution’s rise to its growing research profile, but he added that this was helped by London’s many advantages, including the capital’s high employability and rich culture.
“We’ve probably benefited from the spotlight on Stratford from the Olympics and a general sense that the East End is a ‘happening’ part of London – plugged into Tech City,” he told THE.
Power of inequality
The good news for London is dampened by concerns that the rankings performance may be reflecting growing economic inequality across the country.
Shabana Mahmood, shadow minister for universities and science, said that the government needed to do more to help the regions compete.
“Universities can be powerhouses of growth and are often catalysts for innovation, driving skills across the UK. But they need a government that stands up for them and the communities they are based in,” she said.
Sally Hunt, general secretary of the University and College Union, said that the UK had done well to hold its position on the global stage but warned: “We need to be careful not to widen the gap between North and South – which the rankings suggest is happening.”
Kieron Flanagan, lecturer in science and technology policy at the University of Manchester, said that London’s cluster of research-intensive universities provided a pull for leading researchers that was difficult to counteract.
“Even if cities such as Manchester are doing more and getting stronger, they are being so outpaced by London” because of its multiple research-intensives, the Francis Crick Institute and its number of government-backed technology and innovation “catapults”, he said.
As a result, “they will find it ever harder to compete”, he added.
Dr Flanagan contrasted the UK with countries with more “geographically aware” higher education and research policies, such as the US, where national schemes exist to fund states less favoured by conventional routes. “I can’t think of anywhere that’s as blind to geography as the UK,” he said.
However, he also cautioned against overinterpreting the results, given that the universities of York, Glasgow, Lancaster and Leicester have bucked the regional trend, with the last in the list climbing 35 places.
Worldwide, the US continues to top the rankings, boasting 77 top 200 institutions including the world number one, the California Institute of Technology (maintaining this status for the third year in a row).
However, the rankings also show a continued shift in power from West to East, with universities in China, South Korea, Singapore and Japanmaking gains as the top universities in continental Europe fall.
THE bases the rankings on 13 performance indicators that examine universities’ strengths in teaching, research, knowledge transfer and international outlook, compiled using data from Thomson Reuters.

View our results highlights video, presented by Mishal Husain
Listen to the World University Rankings 2013-2014 podcast
————————–
World University Rankings 2013-2014 methodology

The essential elements in our world-leading formula
Underpinning the World University Rankings is a sophisticated exercise in information-gathering and analysis: here we detail the criteria used to assess the global academy’s greatest universities
The Times Higher Education World University Rankings 2013-2014 are the only global university performance tables to judge research-led universities across all their core missions – teaching, research, knowledge transfer and international outlook.
We employ 13 carefully calibrated performance indicators to provide the most comprehensive and balanced comparisons, which are trusted by students, academics, university leaders, industry and governments.
The methodology for the 2013-2014 World University Rankings is identical to that used since 2011-2012, offering a year-on-year comparison based on true performance rather than methodological change.
Our 13 performance indicators are grouped into five areas:
- Teaching: the learning environment (worth 30 per cent of the overall ranking score)
- Research: volume, income and reputation (worth 30 per cent)
- Citations: research influence (worth 30 per cent)
- Industry income: innovation (worth 2.5 per cent)
- International outlook: staff, students and research (worth 7.5 per cent).
Exclusions
Universities are excluded from the Times Higher Education World University Rankings if they do not teach undergraduates; if they teach only a single narrow subject; or if their research output amounted to fewer than 1,000 articles between 2007 and 2011 (200 a year).
In some exceptional cases, institutions that are below the 200-paper threshold are included if they have a particular focus on disciplines with generally low publication volumes, such as engineering or the arts and humanities.
Further exceptions to the threshold are made for the six specialist subject tables.
Scores
To calculate the overall rankings, “Z-scores” were created for all data sets except for the results of the academic reputation survey.
The calculation of Z-scores standardises the different data types on a common scale and allows fair comparisons between different types of data – essential when combining diverse information into a single ranking.
Each data point is given a score based on its distance from the mean average of the entire data set, where the scale is the standard deviation of the data set.
The Z-score is then turned into a “cumulative probability score” to arrive at the final totals.
If University X has a cumulative probability score of 98, for example, then a random institution from the same data distribution will fall below the institution 98 per cent of the time.
For the results of the reputation survey, the data are highly skewed in favour of a small number of institutions at the top of the rankings, so last year we added an exponential component to increase differentiation between institutions lower down the scale, a method we have retained for the 2013-2014 tables.
Data collection
Institutions provide and sign off their institutional data for use in the rankings.
On the rare occasions when a particular data point is missing – which affects only low-weighted indicators such as industrial income – we enter a low estimate between the average value of the indicators and the lowest value reported: the 25th percentile of the other indicators.
By doing this, we avoid penalising an institution too harshly with a “zero” value for data that it overlooks or does not provide, but we do not reward it for withholding them.
International outlook: People, research (7.5%)
This category looks at diversity on campus and to what degree academics collaborate with international colleagues on research projects – both signs of how global an institution is in its outlook.
The ability of a university to attract undergraduates and postgraduates from all over the planet is key to its success on the world stage: this factor is measured by the ratio of international to domestic students and is worth 2.5 per cent of the overall score.
The top universities also compete for the best faculty from around the globe. So in this category we adopt a 2.5 per cent weighting for the ratio of international to domestic staff.
In the third international indicator, we calculate the proportion of a university’s total research journal publications that have at least one international co-author and reward higher volumes.
This indicator, which is also worth 2.5 per cent, is normalised to account for a university’s subject mix and uses the same five-year window as the “Citations: research influence” category.
Research: Volume, income, reputation (30%)
This category is made up of three indicators. The most prominent, given a weighting of 18 per cent, looks at a university’s reputation for research excellence among its peers, based on the 10,000-plus responses to our annual academic reputation survey.
This category also looks at university research income, scaled against staff numbers and normalised for purchasing-power parity.
This is a controversial indicator because it can be influenced by national policy and economic circumstances.
But income is crucial to the development of world-class research, and because much of it is subject to competition and judged by peer review, our experts suggested that it was a valid measure.
This indicator is fully normalised to take account of each university’s distinct subject profile, reflecting the fact that research grants in science subjects are often bigger than those awarded for the highest- quality social science, arts and humanities research. It is given a weighting of 6 per cent.
The research environment category also includes a simple measure of research productivity – research output scaled against staff numbers.
We count the number of papers published in the academic journals indexed by Thomson Reuters per academic, scaled for a university’s total size and also normalised for subject. This gives an idea of an institution’s ability to get papers published in quality peer-reviewed journals.
This indicator is worth 6 per cent overall.
Citations: Research influence (30%)
Our research influence indicator is the flagship. Weighted at 30 per cent of the overall score, it is the single most influential of the 13 indicators, and looks at the role of universities in spreading new knowledge and ideas.
We examine research influence by capturing the number of times a university’s published work is cited by scholars globally. This year, our data supplier Thomson Reuters examined more than 50 million citations to 6 million journal articles, published over five years. The data are drawn from the 12,000 academic journals indexed by Thomson Reuters’ Web of Science database and include all indexed journals published between 2007 and 2011.
Citations to these papers made in the six years from 2007 to 2012 are also collected.
The citations help show us how much each university is contributing to the sum of human knowledge: they tell us whose research has stood out, has been picked up and built on by other scholars and, most importantly, has been shared around the global scholarly community to push further the boundaries of our collective understanding, irrespective of discipline.
The data are fully normalised to reflect variations in citation volume between different subject areas. This means that institutions with high levels of research activity in subjects with traditionally high citation counts do not gain an unfair advantage.
We exclude from the rankings any institution that publishes fewer than 200 papers a year to ensure that we have enough data to make statistically valid comparisons.
Industry income: Innovation (2.5%)
A university’s ability to help industry with innovations, inventions and consultancy has become a core mission of the contemporary global academy.
This category seeks to capture such “knowledge transfer” by looking at how much research income an institution earns from industry, scaled against the number of academic staff it employs.
“Industry income: innovation” suggests the extent to which businesses are willing to pay for research and a university’s ability to attract funding in the competitive commercial marketplace – useful indicators of institutional quality.
The category is worth 2.5 per cent of the overall ranking score.
Teaching: The learning environment (30%)
This category employs five separate performance indicators designed to provide a clear sense of the teaching and learning environment of each institution from both the student and the academic perspective.
The dominant indicator here uses the results of the world’s largest invitation-only academic reputation survey.
Thomson Reuters carried out its latest reputation survey – a worldwide poll of experienced scholars – in spring 2013.
It examined the perceived prestige of institutions in both research and teaching. There were 16,639 responses, statistically representative of global higher education’s geographical and subject mix.
The results of the survey with regard to teaching make up 15 per cent of the overall rankings score.
The teaching and learning category also employs a staff-to-student ratio (an institution’s total student numbers) as a simple (and admittedly crude) proxy for teaching quality.
The proxy suggests that where there is a healthy ratio of students to staff, the former will get the personal attention they require from the institution’s faculty.
This measure is worth 4.5 per cent of the overall ranking score.
The teaching category also examines the ratio of doctoral to bachelor’s degrees awarded by each institution.
We believe that institutions with a high density of research students are more knowledge-intensive and that the presence of an active postgraduate community is a marker of a research-led teaching environment valued by undergraduates and postgraduates alike.
The doctorate-to-bachelor’s ratio is worth 2.25 per cent of the overall ranking score.
The teaching category also uses data on the number of doctorates awarded by an institution, scaled against its size as measured by the number of academic staff it employs.
As well as giving a sense of how committed an institution is to nurturing the next generation of academics, a high proportion of postgraduate research students also suggests the provision of teaching at the highest level that is thus attractive to graduates and effective at developing them.
Undergraduates also tend to value working in a rich environment that includes postgraduates. This indicator is normalised to take account of a university’s unique subject mix, reflecting the different volume of doctoral awards in different disciplines, and makes up 6 per cent of overall scores.
The final indicator in the category is a simple measure of institutional income scaled against academic staff numbers.
This figure, adjusted for purchasing-power parity so that all nations may compete on a level playing field, indicates the general status of an institution and gives a broad sense of the infrastructure and facilities available to students and staff. This measure is worth 2.25 per cent overall.
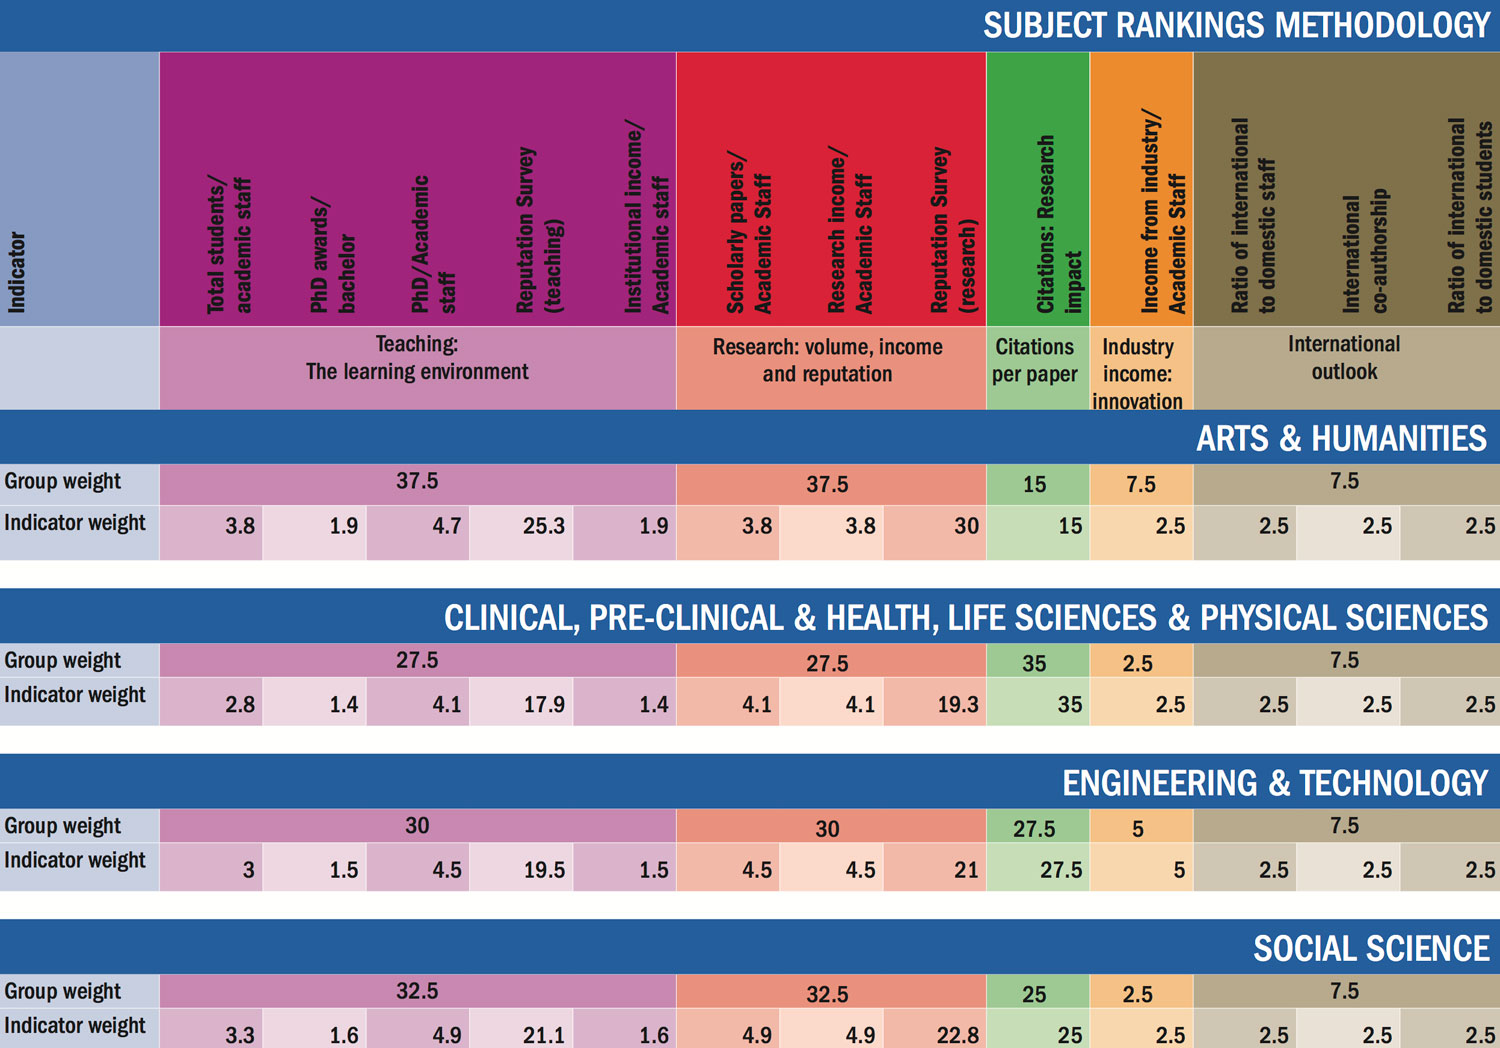
Subject tables
The subject tables employ the same range of 13 performance indicators used in the overall World University Rankings, brought together with scores provided under five categories:
- Teaching: the learning environment
- Research: volume, income and reputation
- Citations: research influence
- International outlook: staff, students and research
- Industry income: innovation.
Here, the overall methodology is carefully recalibrated for each subject, with the weightings changed to best suit the individual fields. In particular, those given to the research indicators have been altered to fit more closely the research culture in each subject, reflecting different publication habits: in the arts and humanities, for instance, where the range of outputs extends well beyond peer-reviewed journals, we give less weight to paper citations.
Accordingly, the weight given to “citations: research influence” is halved from 30 per cent in the overall rankings to just 15 per cent for the arts and humanities.
More weight is given to other research indicators, including the academic reputation survey.
For social sciences, where there is also less faith in the strength of citations alone as an indicator of research excellence, the measure’s weighting is reduced to 25 per cent.
By the same token, in those subjects where the vast majority of research outputs come through journal articles and where there are high levels of confidence in the strength of citations data, we have increased the weighting given to the research influence (up to 35 per cent for the physical and life sciences and for the clinical, pre-clinical and health tables).
A breakdown of the methodology for each subject is provided at the foot of the tables.
Criteria
No institution can be included in the overall World University Rankings unless it has published a minimum of 200 research papers a year over the five years we examine.
But for the six subject tables, the threshold drops to 100 papers a year for subjects that generate a high volume of publications and 50 a year in subjects such as social sciences where the volume tends to be lower.
Although we apply some editorial discretion, we generally expect an institution to have at least 10 per cent of its staff working in the relevant discipline in order to include it in the subject table.
The majority of institutions in Thomson Reuters’ Global Institutional Profiles database, which fuels the rankings, provide detailed subject-level information. In rare cases where such data are not supplied, institutions are either excluded or public sources are used to inform estimates.
Learn more about the Thomson Reuters Global Institutional Profiles project, the data source for the rankings.
The world’s top 100 universities 2013 – how the Times Higher Education ranks them
The California Institute for Technology has retained its place at the top of rankings of the top 100 universities in the world. See how they compare
• Get the data
The. Guardian, October 3, 2013
The California Institute for Technology (Caltech) has been named the best university in the world for the third year in a row in a league table of the world’s best institutions published by Times Higher Education (THE).
Harvard University jumps two places to join Oxford at joint second place whilst Standford university drops two to fourth. Massachusetts Institute of Technology, Princeton University and Cambridge retain their positions from the 2012 rankings with the University of California, Berkeley and the University of Chicago both climbing one place to eighth and ninth place respectively. Imperial College London has slipped to tenth place from eighth in last year’s rankings.
The US continues to dominate with 46 of the top 100 places being taken by an American university – seven make it into the top ten. The UK remains the second best represented country behind the US with 11 institutions in the top 100 whilst the Netherlands boast eight.
Speaking about the rankings, David Willetts, universities minister, said:
“The UK’s universities are recognised around the world for excellence, as the Times Higher league table shows once again. Their fantastic reputation is a testament to the work of the universities, their academics, and the students themselves. However we can not be complacent, with other countries determined to emulate our success.”
The highest-ranked institution outside the US and the UK is Switzerland’s ETH Zürich - Swiss Federal Institute of Technology Zürich, which slips two places to 14th in the latest rankings. Some other key findings in the rankings are:
• There are 26 countries in the world top 200 list – two more than last year. Turkey, Spain and Norway rejoining the group whilst Brazil drops out
• Asia’s number one is the University of Tokyo, rising four places to 23rd
• Germany has 10 universities in the top 200 (one fewer than last year). Its highest-ranked player, Munich, has fallen out of the top 50
• The Middle East is represented in the list by Turkey and Israel. The latter now has two players, down one from last year
• Africa has only a single representative: Cape Town (joint 126th)
The table below shows the top 100 universities featured on the list by their 2012 and 2011 rankings. You can get the top full top 200 list by visiting the THE website. What can you do with this data?
|
2013-14 rank
|
2012-13 rank
|
Institution
|
Country
|
|---|---|---|---|
| 1 | 1 | California Institute of Technology | US |
| 2 | 4 | Harvard University | US |
| 2 | 2 | University of Oxford | UK |
| 4 | 2 | Stanford University | US |
| 5 | 5 | Massachusetts Institute of Technology | US |
| 6 | 6 | Princeton University | US |
| 7 | 7 | University of Cambridge | UK |
| 8 | 9 | University of California, Berkeley | US |
| 9 | 10 | University of Chicago | US |
| 10 | 8 | Imperial College London | UK |
| 11 | 11 | Yale University | US |
| 12 | 13 | University of California, Los Angeles | US |
| 13 | 14 | Columbia University | US |
| 14 | 12 | ETH Zürich - Swiss Federal Institute of Technology Zürich | Switzerland |
| 15 | 16 | Johns Hopkins University | US |
| 16 | 15 | University of Pennsylvania | US |
| 17 | 23 | Duke University | US |
| 18 | 20 | University of Michigan | US |
| 19 | 18 | Cornell University | US |
| 20 | 21 | University of Toronto | Canada |
| 21 | 17 | University College London | UK |
| 22 | 19 | Northwestern University | US |
| 23 | 27 | University of Tokyo | Japan |
| 24 | 22 | Carnegie Mellon University | US |
| 25 | 24 | University of Washington | US |
| 26 | 29 | National University of Singapore | Singapore |
| 27 | 25 | University of Texas at Austin | US |
| 28 | 25 | Georgia Institute of Technology | US |
| 29 | 33 | University of Illinois at Urbana-Champaign | US |
| 30 | 31 | University of Wisconsin-Madison | US |
| 31 | 30 | University of British Columbia | Canada |
| 32 | 39 | London School of Economics and Political Science | UK |
| 33 | 35 | University of California, Santa Barbara | US |
| 34 | 28 | University of Melbourne | Australia |
| 35 | 34 | McGill University | Canada |
| 36 | 42 | Karolinska Institute | Sweden |
| 37 | 40 | École Polytechnique Fédérale de Lausanne | Switzerland |
| 38 | 57 | King’s College London | UK |
| 39 | 32 | University of Edinburgh | UK |
| 40 | 41 | New York University | US |
| 40 | 38 | University of California, San Diego | US |
| 42 | 44 | Washington University in St Louis | US |
| 43 | 35 | University of Hong Kong | Hong Kong |
| 44 | 59 | Seoul National University | South Korea |
| 45 | 46 | Peking University | China |
| 46 | 47 | University of Minnesota | US |
| 47 | 42 | University of North Carolina at Chapel Hill | US |
| 48 | 37 | Australian National University | Australia |
| 49 | 61 | Pennsylvania State University | US |
| 50 | 54 | Boston University | US |
| 50 | 52 | Tsinghua University | China |
| 52 | 51 | Brown University | US |
| 52 | 44 | University of California, Davis | US |
| 52 | 54 | Kyoto University | Japan |
| 55 | 48 | University of Munich | Germany |
| 56 | 68 | Korea Advanced Institute of Science and Technology | South Korea |
| 57 | 65 | Hong Kong University of Science and Technology | Hong Kong |
| 58 | 49 | University of Manchester | UK |
| 59 | 53 | Ohio State University | US |
| 60 | 50 | Pohang University of Science and Technology | South Korea |
| 61 | 58 | KU Leuven | Belgium |
| 62 | 69 | Purdue University | US |
| 63 | 70 | University of Gottingen | Germany |
| 63 | 65 | University of Queensland | Australia |
| 65 | 59 | École Normale Supérieure, Paris | France |
| 65 | 75 | Rice University | US |
| 67 | 64 | Leiden University | Netherlands |
| 68 | 78 | University of Heidelberg | Germany |
| 69 | 77 | Delft University of Technology | Netherlands |
| 70 | 62 | École Polytechnique | France |
| 70 | 56 | University of Southern California | US |
| 72 | 62 | University of Sydney | Australia |
| 73 | 72 | Erasmus University Rotterdam | Netherlands |
| 74 | 142 | University of Basel | Switzerland |
| 74 | 67 | Utrecht University | Netherlands |
| 76 | 86 | Nanyang Technological University | Singapore |
| 77 | 70 | Wageningen University and Research Center | Netherlands |
| 78 | 76 | University of Pittsburgh | US |
| 79 | 74 | University of Bristol | UK |
| 80 | 80 | Durham University | UK |
| 80 | 79 | Emory University | US |
| 80 | 87 | Tufts University | US |
| 83 | 83 | University of Amsterdam | Netherlands |
| 83 | 94 | Michigan State University | US |
| 85 | 93 | Ghent University | Belgium |
| 86 | 128 | Free University of Berlin | Germany |
| 87 | 105 | Technical University of Munich | Germany |
| 88 | 104 | Case Western Reserve University | US |
| 88 | 106 | Vanderbilt University | US |
| 90 | 94 | University of Notre Dame | US |
| 91 | 99 | Monash University | Australia |
| 92 | 88 | McMaster University | Canada |
| 93 | 96 | University of California, Irvine | US |
| 94 | 99 | Humboldt University of Berlin | Germany |
| 95 | 102 | University of Rochester | US |
| 96 | 81 | Pierre and Marie Curie University | France |
| 97 | 91 | University of Colorado Boulder | US |
| 98 | 89 | University of Groningen | Netherlands |
| 98 | 115 | Maastricht University | Netherlands |
| 100 | 109 | University of Helsinki | Finland |
| 100 | 103 | University of York | UK |
0 Comments